Chances are, if you clicked on this article you have a website. Even better, you likely have a plethora of meaningful data at your fingertips and don’t even know it. Google Analytics gives you access to a number of metrics and stats on your website and digital traffic, so if you have GA set up on your website already, pat yourself on the back. Even though GA gives you a ton of information about your website, this data is meaningless without context, and many of the metrics you assume you should look at are misunderstood. What metrics actually matter?
If you want to win with your website, you’re going to have to win with analytics. The only way to know if a website is performing well is by strategic measurement of website engagement. Part of interpreting website engagement comes from understanding data context and being able to discern the story your data is telling you. Numbers alone don’t tell you how engaging your website is. So how do you know if your web traffic is engaged?
1: Bounce/Exit Rate
Bounce rate and exit rate are not the same and should not be confused. For the purposes of looking at how engaged your website traffic is though, we will look at these two metrics together.
Bounce rate is the percentage of single page sessions. Google defines it “for all sessions that start with the page, Bounce Rate is the percentage that were the only one of the session [Cited].” What this means is that if a user enters your site from the home page, but doesn’t navigate any further into the site, the home page just experienced a bounce, thus raising the bounce rate. Perhaps the page is confusing and people don’t know where to go next. Maybe users found your site organically and upon entering the site realize it’s not relevant to what they are looking for. This could be a content or SEO issue. Let’s face it though, even the most engaging website in the world is still going to experience bounces.
So what’s a healthy bounce rate?
This is a question that’s up for debate, as there’s no tried and true answer. Many will say 30% is too high. Others say between 40% and 60% is a healthy bounce rate. In reality it really depends on your website. Let’s say you’re running a paid campaign that directs to a custom landing page with the intention of creating awareness for an upcoming product release. Your page has a description of the product and an embedded video. You go into Google Analytics and find out that the page has an 85% bounce rate. Your heart rate escalates, cold sweat drips from your pores as you run to your marketing department to find out why they’re failing your company.
They calmly tell you that the bounce rate, although a high number, is nothing to be concerned about. Before you fire your staff, let me tell you, THEY’RE KINDA RIGHT. Although few users are navigating further than the landing page, they have no reason to. With a goal of awareness, you aren’t optimizing your campaign for site navigation. Most likely, your landing page doesn’t have any call to action to navigate further into the site.
The real issue here is that you need to track a click or some form of interaction, to measure that users are engaging with your site, and therefore not bouncing. If Google records an event occurrence on the page, even if it’s the only page viewed, it won’t count as a bounce. Long story short: take the purpose and setup of your site or page into account when looking at bounce rate.
2: Time on Page
Time on page can be invaluable for measuring website engagement, especially if you run a content website. One thing to keep in mind when you’re analyzing your time on site is that by default, Google Analytics times out a session after 30 minutes. This just means that it won’t count past 30 minutes and if you navigate to another page at 30:01 it will count that as a new session. If you have a page with a 35-minute video on it, you should definitely change this setting.
Additionally, the session timeout caps out at a maximum of 4 hours. And if you have content on one page that takes 4 hours to get through though, your site may need some extra TLC. In that case just call us… please. We can help.
Context . . . Again.
As with bounce rate, you have to look at the context surrounding average time on site in order to get the full benefit from this metric. Although more time spent on site would seem better, it actually might mean the user doesn’t know where to go, or how to navigate.
If the page is a products page or a search page, intended to link to other pages on the site, then a long time on page means something is breaking the flow in user experience. Take a look at your pages, pretend you haven’t seen the site before, and consider how long it should take someone to navigate these pages. If you have a page with a long article, or a two-minute video, and users only spend an average of 30 seconds on the page, then you have an issue.
One thing to note is whether or not the page has a high bounce or exit rate. If either of these are very high then you don’t have an accurate time on page metric. Time on page is measured as the amount of time that passed between when a user entered the page and then navigated to another page. If the user didn’t navigate to another page, then there’s no measurement, and Google Analytics records the time as zero. Therefore, if you’re looking at a high bounce rate, work toward optimizing that and take your time on site with a grain of salt.
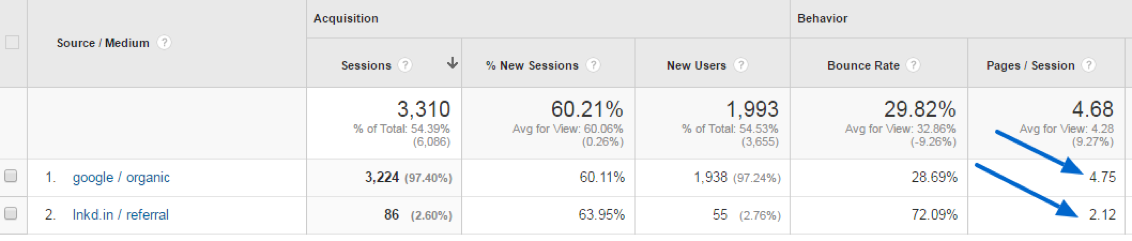
3: Average Pages Viewed
Average pages viewed is the number of pages on your site that a user views during a session. This metric can make it very clear whether or not users can find their way around your site, or if they get confused and give up. This is another metric where context makes a big difference.
Perhaps you have a media publishing site. Your site is full of single page articles and you get most of your traffic from social media. Your average pages per session is 1.45, and you’re concerned. Being that most of the traffic you attain is from social media users clicking links to read an article and then leaving, a low average pages viewed is to be expected. You might want to try some CTAs on the page to coax users into reading similar articles, or lead users to more pages by referring to other articles within the page text and linking to them.
What if you run an ecommerce site, and your average pages viewed is 1.45? That’s a problem. Depending on the design of your site, it’s likely user navigation should go something like: homepage – product category page – specific product page – shopping cart page and finally checkout page. That’s the most streamlined way of looking at it, and users will likely view multiple products without making a purchase on their first visit. That being the case, you at least want the average pages viewed to be 3, but the reality here is that most users don’t go past the home page. Why? Maybe the navigation bar doesn’t provide an understandable description of product categories, or maybe the homepage is hard to view in certain browsers. This metric can give you insight into further steps you can take to engage your website traffic.
4: Mobile Engagement
Although this isn’t a specific metric to look at, Mobile Device Overview is a dimension in Google Analytics that is very telling about your website engagement. In 2015, Google searches on mobile devices surpassed searches on desktop. If your site isn’t mobile-friendly, then engagement will be poor, and the site will deter a large audience from engagement.
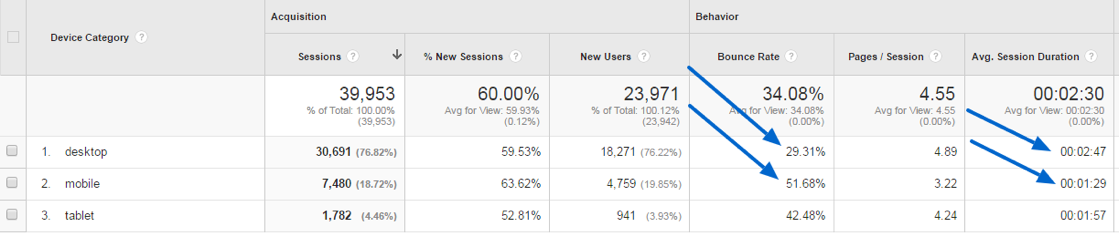
The Mobile overview section in Google Analytics gives you an overview of engagement metrics by device: desktop, mobile and tablet. In the above example we see that desktop has a low bounce rate of 29% and session duration of 2:47. Mobile engagement isn’t as high of a performer, with nearly a 52% bounce rate and an average session duration of 1:29.
Mobile engagement is commonly not as good as desktop, however when there is a large difference it signals the opportunity to further dig into why performance is low. If your website doesn’t display well on mobile devices, users won’t bother engaging with it. Furthermore, if your goal is something such as a form completion, that form needs to be short and optimized for mobile engagement.
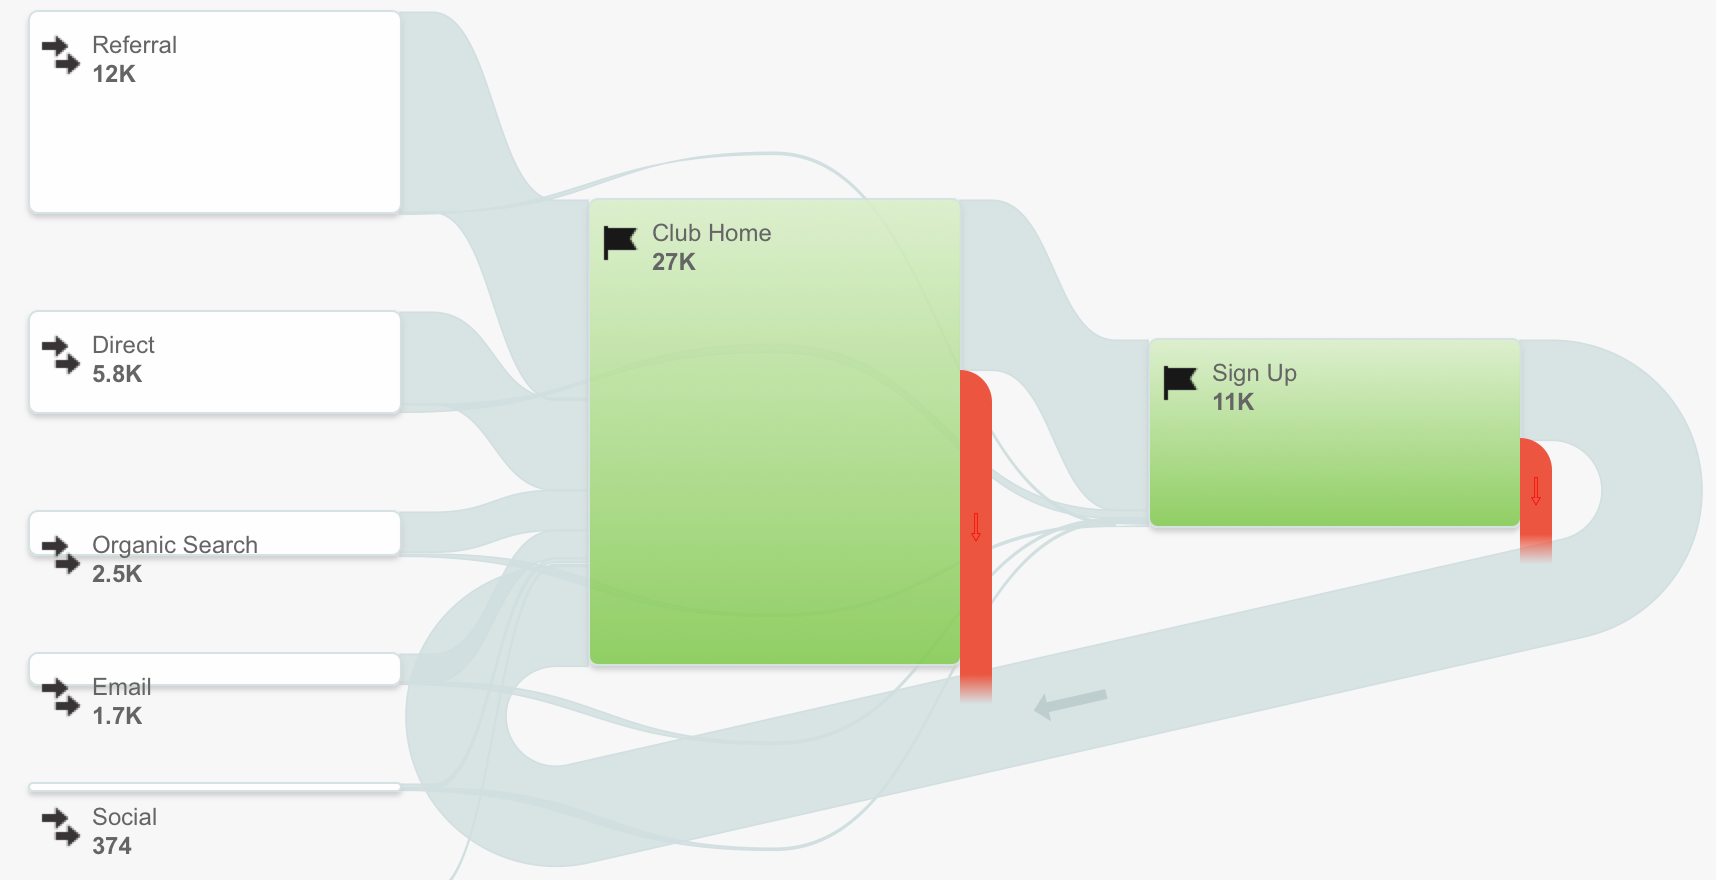
5: Goals/Event Tracking
This is where we get into proactive measures for tracking your website traffic, and also dig into the previously mentioned topic of event tracking. Of course you can log into Google Analytics and view basic metrics like bounce rate and time on page as those are default metrics GA calculates. But the most meaningful insight will come when you measure specific goals on your site. The best way to get started is by putting together a digital measurement plan, where you lay out your business goals, how your website will help achieve those goals and which website metrics will show whether or not you’re succeeding with said goals (i.e. winning).
A common goal tracked in Google Analytics is form completions. If you have a signup form on your website, you can use goal tracking to measure the conversion rate on the form (the percentage of users visiting your site who completed the form) and also form drop-offs.
Form drop-offs is also a key engagement measurement, because you can view at what point while filling out the form a user decided to stop. Maybe the form is too long, maybe a question is worded in a way that confuses the user, or perhaps they just don’t want to give you a piece of information you’re looking for. Digging into this data will provide insight into possible optimizations for your form, such as changing or removing questions.
Of course there are many actions you can set up as goals on your website. If you want a certain number of pageviews, or a time on site to be a goal, you can set that up and see a goal conversion rate for the number of users who spent more than two minutes on your site. You may also set up custom event tracking.
Events are interactions with content on your website, which can be set up with custom javascript or Google Tag Manager implementation. An event could be something like clicking an external link to view a third-party payment site, or clicking a “continue reading” tab on your content page. Event tracking setup can be simple for basic events, to very complex for specific website goal events. Once Google Analytics is pulling these custom events in, you may track them as goal conversions. We can help determine what events will show your website is “winning” and get these implemented for successful tracking.
In Summary
At the end of the day, standard Google Analytics metrics can give you invaluable insight into your website. Furthermore, it will give you a direction for deeper investigation and analysis of how users are engaging with your website.
With more complicated implementations and tracking, you can turn your site into a conversion powerhouse. Once you’re collecting actionable data, you can provide your customers with an optimal site experience, which your bottom line will ultimately reflect.
To talk about your site performance and what opportunities you have to bring in more revenue, contact us today. We would love to talk website analytics over a beer, or over the phone – whatever floats your boat.
Subscribe to our newsletter
Get our insights and perspectives delivered to your inbox.